Posts

Index of Core Industries February 2021

Image
New data for Index of Core Industries: 2021 February: 127.8 2020 February: 134.0 YoY growth: -4.6% Details: The Ministry of Commerce and Industry Office of Economic Adviser (OEA), Department of Industrial Policy & Promotion (DIPP), reports a monthly index, ICI, "Index of Eight Core Industries (Base: 2011-12=100)".  "The Eight Core Industries comprise 40.27 per cent of the weight of items included in the Index of Industrial Production (IIP)." These are Coal, Crude Oil, Natural Gas, Refinery Products, Fertilizers, Steel, Cement, Electricity.   Also see:  https://currentaffairs.gktoday.in/tags/index-of-eight-core-industries The index: (note: reverse-chronological order) Month Index Revisions (second) (first) 2021 Feb 127.8 2021 Jan 138.7 (137.6) 2020 Dec 135.9 (133.8) 2020 Nov 127.7 (127.4) (125.9) 2020 Oct 126.7 (126.2) (124.2) 2020 Sep 121.4 (120.5) (119.7) 2020 Aug 119.7 (119.1) (117.6) 2020 Jul 122.5 (122.0) (119.9) 2020 Jun 116.3 (...
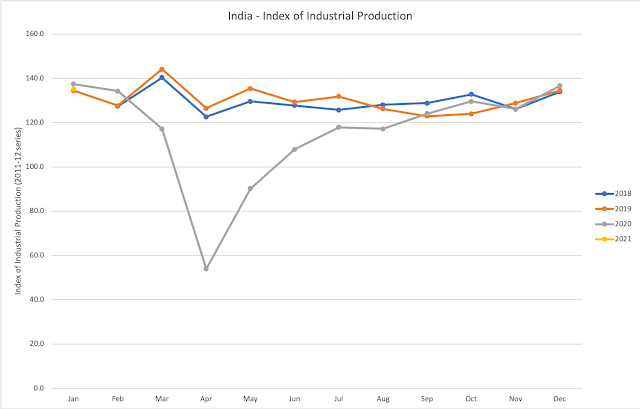
Index of Industrial Production January 2021

Image
January 2021 IIP = 135.2 January 2020 IIP = 137.4 YoY growth: -1.6% {Wiki} The level of the Index of Industrial Production (IIP) is an abstract number, the magnitude of which represents the status of production in the industrial sector for a given period of time as compared to a reference period of time. Index of Industrial Production - IIP - 2011-12 series, with 2011-12 normalized to 100 at the monthly level. The data is in reverse chronological order. Year Month IIP YoY Revisions (second) (first) 2021 Jan. 135.2 -1.6% 2020 Dec 136.6 1.6% (135.9) 2020 Nov 126.1 -2.1% (126.3) 2020 Oct 129.6 4.5% (129.2) (128.5) 2020 Sep 124.1 0.1% (123.5) (123.2) 2020 Aug 117.2 (116.9) (116.1) 2020 Jul 117.9 (117.6) (118.1) 2020 Jun 107.9 (108.9) (107.8) 2020 May 90.2 ( 89.5) ( 88.4) 2020 Apr 54.0 ( 53.6) ( 56.3) 2020 Mar 117.2 -18.7% (117.7) (120.1) 2020 Feb 134.2 5.2% (133.5) (133.3) 2020 Jan 137.4 2.2% (137.2) (137.1) ...

IHS Markit India PMI 03/21

The IHS Markit Purchasing Managers' Index (PMI) is a leading indicator of economic activity.  A PMI above 50 indicates expected growth in economic activity. Manufacturing PMI   " Posting 57.5 in February, the seasonally adjusted IHS Markit India Manufacturing Purchasing Managers’ Index® (PMI®) highlighted a strong improvement in operating conditions that was broadly similar to that recorded in January (57.7). The headline figure remained above its long-run average of 53.6.   Services PMI   "Rising from 52.8 in January to 55.3 in February, the seasonally adjusted India Services Business Activity Index pointed to the sharpest rate of expansion in output in one year. Moreover, the latest reading extended the current growth sequence to five months." "Indian private sector output rose at the quickest pace in four 60 months during February. The Composite* PMI Output Index 50 increased from 55.8 in January to 57.3, highlighting a sharp rate 40 of expansion tha...

Index of Core Industries January 2021

Image
New data for Index of Core Industries: 2021 January: 137.6 2020 January: 137.4 YoY growth: 0.1% Details: The Ministry of Commerce and Industry Office of Economic Adviser (OEA), Department of Industrial Policy & Promotion (DIPP), reports a monthly index, ICI, "Index of Eight Core Industries (Base: 2011-12=100)".  "The Eight Core Industries comprise 40.27 per cent of the weight of items included in the Index of Industrial Production (IIP)." These are Coal, Crude Oil, Natural Gas, Refinery Products, Fertilizers, Steel, Cement, Electricity.   Also see:  https://currentaffairs.gktoday.in/tags/index-of-eight-core-industries The index: (note: reverse-chronological order) Month Index Revisions (second) (first) 2021 Jan 137.6 2020 Dec 135.9 (133.8) 2020 Nov 127.4 (125.9) 2020 Oct 126.7 (126.2) (124.2) 2020 Sep 121.4 (120.5) (119.7) 2020 Aug 119.7 (119.1) (117.6) 2020 Jul 122.5 (122.0) (119.9) 2020 Jun 116.3 (115.6) (112.9) 2020 May 107.7 (10...

Index of Industrial Production December 2020

December 2020 IIP = 135.9 December 2019 IIP = 134.5 YoY growth: 1.0% {Wiki} The level of the Index of Industrial Production (IIP) is an abstract number, the magnitude of which represents the status of production in the industrial sector for a given period of time as compared to a reference period of time. Index of Industrial Production - IIP - 2011-12 series, with 2011-12 normalized to 100 at the monthly level. The data is in reverse chronological order. Year Month IIP YoY Revisions (second) (first) 2020 Dec 135.9 1.0% 2020 Nov 126.1 -2.1% (126.3) 2020 Oct 129.2 4.2% (128.5) 2020 Sep 124.1 0.1% (123.5) (123.2) 2020 Aug 117.2 (116.9) (116.1) 2020 Jul 117.9 (117.6) (118.1) 2020 Jun 107.9 (108.9) (107.8) 2020 May 90.2 ( 89.5) ( 88.4) 2020 Apr 54.0 ( 53.6) ( 56.3) 2020 Mar 117.2 -18.7% (117.7) (120.1) 2020 Feb 134.2 5.2% (133.5) (133.3) 2020 Jan 137.4 2.2% (137.2) (137.1) 2019 Dec 134.5 0.0% (134.0) (1...

IHS Markit India PMI 02/21

These are leading indicators of economic activity.  A PMI above 50 indicates expected growth in economic activity. Manufacturing PMI   "The seasonally adjusted IHS Markit India Manufacturing Purchasing Managers’ Index® (PMI®) rose from 56.4 in December to 57.7 in January, to signal the strongest improvement in the health of the sector in three months."   Services PMI   "The seasonally adjusted India Services Business Activity Index rose from 52.3 in December to 52.8 in January, pointing to a quicker expansion in output. Still, the headline figure remained below its long-run average of 53.3 and was consistent with a moderate pace of growth." "The Composite* PMI Output Index edged up to 55.8 in January, from 54.9 in December, thereby remaining above its long-run average of 53.9." Next updates: Manufacturing 2021/03/01 Services: 2021/03/03

Index of Core Industries December 2020

New data for Index of Core Industries: 2020 December: 133.8 2019 December: 135.5 YoY growth: -1.3%  Details: The Ministry of Commerce and Industry Office of Economic Adviser (OEA), Department of Industrial Policy & Promotion (DIPP), reports a monthly index, ICI, "Index of Eight Core Industries (Base: 2011-12=100)".  "The Eight Core Industries comprise 40.27 per cent of the weight of items included in the Index of Industrial Production (IIP)." These are Coal, Crude Oil, Natural Gas, Refinery Products, Fertilizers, Steel, Cement, Electricity.   Also see:  https://currentaffairs.gktoday.in/tags/index-of-eight-core-industries The index: (note: reverse-chronological order) Month Index Revisions (second) (first) 2020 Dec 133.8 2020 Nov 127.4 (125.9) 2020 Oct 126.2 (124.2) 2020 Sep 121.4 (120.5) (119.7) 2020 Aug 119.7 (119.1) (117.6) 2020 Jul 122.5 (122.0) (119.9) 2020 Jun 116.3 (115.6) (112.9) 2020 May 107.7 (106.9) (105.0) 2020 Apr 81...