Posts

Showing posts with the label IIP

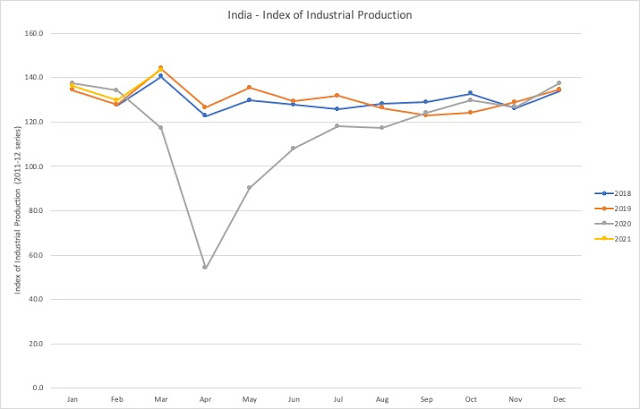
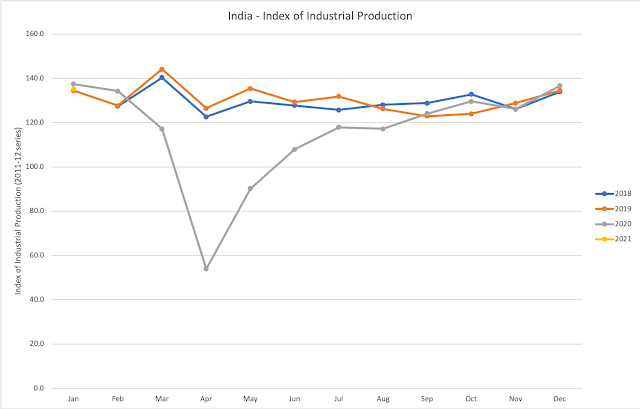
Index of Industrial Production up to July 2023

Image
Month 2018 2019 2020 2021 2022 2023 Jan   134.4 137.4 136.6 139.3 147.4 Feb 127.4 127.6 134.2 129.9 131.4 139.3 Mar 140.3 144.1 117.2 145.6 148.8 151.7 Apr 122.6 126.5 54.0 126.1 134.5 140.7 May 129.6 135.4 90.2 115.1 137.8 145.1 Jun 127.7 129.3 107.9 122.8 138.3 143.5 Jul 125.7 131.8 117.9 131.5 134.4 142.0 Aug 128.0 126.2 117.2 132.4 131.5   Sep 128.8 122.9 124.1 129.5 133.8   Oct 132.8 124.0 129.6 135.0 129.5   Nov 126.1 128.8 126.7 128.0 137.7   Dec 133.9 134.5 137.4 138.8 145.9  

Index of Eight Core Industries July 2022

  Month 2018 2019 2020 2021 2022 Jan   134.5 137.4 139.2 144.8 Feb 123.2 125.9 134.0 129.6 137.1 Mar 138.5 146.5 134.0 150.8 158.0 Apr 124.3 130.7 81.2 132.0 144.6 May 131.9 137.0 107.7 125.4 149.5 Jun 131.2 132.8 116.3 127.2 144.0 Jul 129.2 132.6 122.5 134.7 140.7 Aug 128.8 128.5 119.7 134.2   Sep 127.2 120.7 121.4 128.0   Oct 134.8 127.4 126.7 137.8   Nov 128.3 129.2 127.7 131.8   Dec 131.5 135.5 136.1 141.7  

Index of Industrial Production, October 2021

Image

Index of Industrial Production March 2021

Image
March 2021 IIP = 143.4 March 2020 IIP = 117.2 YoY growth: 22.4% {Wiki} The level of the Index of Industrial Production (IIP) is an abstract number, the magnitude of which represents the status of production in the industrial sector for a given period of time as compared to a reference period of time. Index of Industrial Production - IIP - 2011-12 series, with 2011-12 normalized to 100 at the monthly level. The data is in reverse chronological order. Year Month IIP YoY Revisions (second) (first) 2021 Mar. 143.4 22.4% 2021 Feb 129.6 -3.4% (129.4) 2021 Jan 136.2 -0.9% (135.2) 2020 Dec 137.4 2.2% (136.6) (135.9) 2020 Nov 126.7 -1.6% (126.1) (126.3) 2020 Oct 129.6 4.5% (129.2) (128.5) 2020 Sep 124.1 0.1% (123.5) (123.2) 2020 Aug 117.2 (116.9) (116.1) 2020 Jul 117.9 (117.6) (118.1) 2020 Jun 107.9 (108.9) (107.8) 2020 May 90.2 ( 89.5) ( 88.4) 2020 Apr 54.0 ( 53.6) ( 56.3) 2020 Mar 117.2 -18.7% (117.7) (120.1) ...

Index of Industrial Production February 2021

Image
February 2021 IIP = 129.4 February 2020 IIP = 134.2 YoY growth: -3.6% {Wiki} The level of the Index of Industrial Production (IIP) is an abstract number, the magnitude of which represents the status of production in the industrial sector for a given period of time as compared to a reference period of time. Index of Industrial Production - IIP - 2011-12 series, with 2011-12 normalized to 100 at the monthly level. The data is in reverse chronological order. Year Month IIP YoY Revisions (second) (first) 2021 Feb 129.4 -3.6% 2021 Jan 136.2 -0.9% (135.2) 2020 Dec 136.6 1.6% (135.9) 2020 Nov 126.7 -1.6% (126.1) (126.3) 2020 Oct 129.6 4.5% (129.2) (128.5) 2020 Sep 124.1 0.1% (123.5) (123.2) 2020 Aug 117.2 (116.9) (116.1) 2020 Jul 117.9 (117.6) (118.1) 2020 Jun 107.9 (108.9) (107.8) 2020 May 90.2 ( 89.5) ( 88.4) 2020 Apr 54.0 ( 53.6) ( 56.3) 2020 Mar 117.2 -18.7% (117.7) (120.1) 2020 Feb 134.2 5.2% (133.5) (1...

Index of Industrial Production January 2021

Image
January 2021 IIP = 135.2 January 2020 IIP = 137.4 YoY growth: -1.6% {Wiki} The level of the Index of Industrial Production (IIP) is an abstract number, the magnitude of which represents the status of production in the industrial sector for a given period of time as compared to a reference period of time. Index of Industrial Production - IIP - 2011-12 series, with 2011-12 normalized to 100 at the monthly level. The data is in reverse chronological order. Year Month IIP YoY Revisions (second) (first) 2021 Jan. 135.2 -1.6% 2020 Dec 136.6 1.6% (135.9) 2020 Nov 126.1 -2.1% (126.3) 2020 Oct 129.6 4.5% (129.2) (128.5) 2020 Sep 124.1 0.1% (123.5) (123.2) 2020 Aug 117.2 (116.9) (116.1) 2020 Jul 117.9 (117.6) (118.1) 2020 Jun 107.9 (108.9) (107.8) 2020 May 90.2 ( 89.5) ( 88.4) 2020 Apr 54.0 ( 53.6) ( 56.3) 2020 Mar 117.2 -18.7% (117.7) (120.1) 2020 Feb 134.2 5.2% (133.5) (133.3) 2020 Jan 137.4 2.2% (137.2) (137.1) ...

Index of Industrial Production December 2020

December 2020 IIP = 135.9 December 2019 IIP = 134.5 YoY growth: 1.0% {Wiki} The level of the Index of Industrial Production (IIP) is an abstract number, the magnitude of which represents the status of production in the industrial sector for a given period of time as compared to a reference period of time. Index of Industrial Production - IIP - 2011-12 series, with 2011-12 normalized to 100 at the monthly level. The data is in reverse chronological order. Year Month IIP YoY Revisions (second) (first) 2020 Dec 135.9 1.0% 2020 Nov 126.1 -2.1% (126.3) 2020 Oct 129.2 4.2% (128.5) 2020 Sep 124.1 0.1% (123.5) (123.2) 2020 Aug 117.2 (116.9) (116.1) 2020 Jul 117.9 (117.6) (118.1) 2020 Jun 107.9 (108.9) (107.8) 2020 May 90.2 ( 89.5) ( 88.4) 2020 Apr 54.0 ( 53.6) ( 56.3) 2020 Mar 117.2 -18.7% (117.7) (120.1) 2020 Feb 134.2 5.2% (133.5) (133.3) 2020 Jan 137.4 2.2% (137.2) (137.1) 2019 Dec 134.5 0.0% (134.0) (1...

Index of Industrial Production November 2020

November 2020 IIP = 126.3 November 2019 IIP = 128.8 YoY growth: -1.9% {Wiki} The level of the Index of Industrial Production (IIP) is an abstract number, the magnitude of which represents the status of production in the industrial sector for a given period of time as compared to a reference period of time. Index of Industrial Production - IIP - 2011-12 series, with 2011-12 normalized to 100 at the monthly level. The data is in reverse chronological order. Year Month IIP YoY Revisions (second) (first) 2020 Nov 126.3 -1.9% 2020 Oct 129.2 4.2% (128.5) 2020 Sep 123.5 0.0% (123.2) 2020 Aug 117.2 (116.9) (116.1) 2020 Jul 117.9 (117.6) (118.1) 2020 Jun 107.9 (108.9) (107.8) 2020 May 90.2 ( 89.5) ( 88.4) 2020 Apr 54.0 ( 53.6) ( 56.3) 2020 Mar 117.2 -18.7% (117.7) (120.1) 2020 Feb 134.2 5.2% (133.5) (133.3) 2020 Jan 137.4 2.2% (137.2) (137.1) 2019 Dec 134.5 0.0% (134.0) (133.5)' 2019 Nov 128.8 1.8% (1...

Index of Industrial Production October 2020

October 2020 IIP = 128.5 October 2019 IIP = 124.0 YoY growth: 3.6% {Wiki} The level of the Index of Industrial Production (IIP) is an abstract number, the magnitude of which represents the status of production in the industrial sector for a given period of time as compared to a reference period of time. Index of Industrial Production - IIP - 2011-12 series, with 2011-12 normalized to 100 at the monthly level. The data is in reverse chronological order. Year Month IIP YoY Revisions (second) (first) 2020 Oct 128.5 3.6% 2020 Sep 123.5 0.0% (123.2) 2020 Aug 116.9 (116.1) 2020 Jul 117.9 (117.6) (118.1) 2020 Jun 107.9 (108.9) (107.8) 2020 May 90.2 ( 89.5) ( 88.4) 2020 Apr 54.0 ( 53.6) ( 56.3) 2020 Mar 117.2 -18.7% (117.7) (120.1) 2020 Feb 134.2 5.2% (133.5) (133.3) 2020 Jan 137.4 2.2% (137.2) (137.1) 2019 Dec 134.5 0.0% (134.0) (133.5)' 2019 Nov 128.8 1.8% (128.4) (128.4) 2019 Oct 124.0 -6.6% (127.5)...

Index of Industrial Production September 2020

September 2020 IIP = 123.2 September 2019 IIP = 122.9 YoY growth: 0.0% {Wiki} The level of the Index of Industrial Production (IIP) is an abstract number, the magnitude of which represents the status of production in the industrial sector for a given period of time as compared to a reference period of time. Index of Industrial Production - IIP - 2011-12 series, with 2011-12 normalized to 100 at the monthly level. The data is in reverse chronological order. Year Month IIP YoY Revisions (second) (first) 2020 Sep 123.2 2020 Aug 116.9 (116.1) 2020 Jul 117.6 (118.1) 2020 Jun 107.9 (108.9) (107.8) 2020 May 90.2 ( 89.5) ( 88.4) 2020 Apr 54.0. ( 53.6) ( 56.3) 2020 Mar 117.2 -18.7% (117.7) (120.1) 2020 Feb 134.2 5.2% (133.5) (133.3) 2020 Jan 137.4 2.2% (137.2) (137.1) 2019 Dec 134.5 0.0% (134.0) (133.5)' 2019 Nov 128.8 1.8% (128.4) (128.4) 2019 Oct 124.0 -6.6% (127.5) (127.7) 2019 Sep 122.9 -4.6% (123.2) (...

Index of Industrial Production August 2020

August 2020 IIP = 116.1 August 2019 IIP = 126.2 With the gradual relaxation of restrictions, there has been a relative improvement in the economic activities by varying degrees as well as in data reporting. {Wiki} The level of the Index of Industrial Production (IIP) is an abstract number, the magnitude of which represents the status of production in the industrial sector for a given period of time as compared to a reference period of time. Index of Industrial Production - IIP - 2011-12 series, with 2011-12 normalized to 100 at the monthly level. The data is in reverse chronological order. Year Month IIP YoY Revisions (second) (first) 2020 Aug 116.1 2020 Jul 117.6 (118.1) 2020 Jun 108.9 (107.8) 2020 May 90.2 ( 89.5) ( 88.4) 2020 Apr 54.0. ( 53.6) ( 56.3) 2020 Mar 117.2 -18.7% (117.7) (120.1) 2020 Feb 134.2 5.2% (133.5) (133.3) 2020 Jan 137.4 2.2% (137.2) (137.1) 2019 Dec 134.5 0.0% (134.0) (133.5)' 2019 Nov 128.8 ...

Index of Industrial Production July 2020

July 2020 IIP = 118.1 July 2019 IIP = 131.8 In view of the preventive measures and announcement of nation-wide lockdown by the Government to contain spread of COVID-19 pandemic, a large number of the industrial sector establishments were not operating from the end of March, 2020 onwards. This has had an impact on the items being produced by the establishments during the period of lockdown. With the lifting of restrictions in the subsequent periods, industrial activity is resuming. The Index for the month of July 2020 stands at 118.1 as compared to 54.0, 89.5 and 108.9 for April 2020, May 2020 and June 2020. {Wiki} The level of the Index of Industrial Production (IIP) is an abstract number, the magnitude of which represents the status of production in the industrial sector for a given period of time as compared to a reference period of time. Index of Industrial Production - IIP - 2011-12 series, with 2011-12 normalized to 100 at the monthly level. The data is in reverse chronologica...

Index of Industrial Production June 2020

June 2020 IIP = 107.8 June 2019 IIP = 129.3 In view of the preventive measures and announcement of nation-wide lockdown by the Government to contain spread of COVID-19 pandemic, a large number of the industrial sector establishments were not operating from the end of March, 2020 onwards. This has had an impact on the items being produced by the establishments during the period of lockdown. With the lifting of restrictions in the subsequent periods, industrial activity is resuming. The Index for the month of June 2020 stands at 107.8 as compared to 53.6 and 89.5 for April 2020and May 2020. {Wiki} The level of the Index of Industrial Production (IIP) is an abstract number, the magnitude of which represents the status of production in the industrial sector for a given period of time as compared to a reference period of time. Index of Industrial Production - IIP - 2011-12 series, with 2011-12 normalized to 100 at the monthly level. The data is in reverse chronological order. Year Mon...

Index of Industrial Production May 2020

May 2020 IIP = 88.4 May 2019 IIP = 135.4 In view of the preventive measures and announcement of nation-wide lockdown by the Government to contain spread of COVID-19 pandemic, majority of the industrial sector establishments were not operating from the end of March, 2020 onwards. This has had an impact on the items being produced by the establishments during the period of lockdown and the subsequent periods of conditional relaxations in restrictions. The Index for the month of May 2020 stands at 88.4 as compared to 53.6 for April 2020, indicating a graded pickup in industrial activity in the economy. {Wiki} The level of the Index of Industrial Production (IIP) is an abstract number, the magnitude of which represents the status of production in the industrial sector for a given period of time as compared to a reference period of time. Index of Industrial Production - IIP - 2011-12 series, with 2011-12 normalized to 100 at the monthly level. The data is in reverse chronological order....

Index of Industrial Production April 2020

April 2020 IIP = 56.3 April 2019 IIP = 126.5 In view of the preventive measures and announcement of nation-wide lockdown by the Government to contain spread of COVID-19 pandemic, majority of the industrial sector establishments were not operating from the end of March, 2020 onwards. This has had an impact on the items being produced by the establishments during the month of April, 2020, where a number of responding units have reported NIL production. Consequently, it is not appropriate to compare the IIP of April, 2020 with earlier months and users may like to observe the changes in IIP in the following months. {Wiki} The level of the Index of Industrial Production (IIP) is an abstract number, the magnitude of which represents the status of production in the industrial sector for a given period of time as compared to a reference period of time. Index of Industrial Production - IIP - 2011-12 series, with 2011-12 normalized to 100 at the monthly level. The data is in reverse chronolo...

Index of Industrial Production March 2020

March 2020 IIP = 120.1 March 2019 IIP = 144.1 YoY growth rate= -16.7% {Wiki} The level of the Index of Industrial Production (IIP) is an abstract number, the magnitude of which represents the status of production in the industrial sector for a given period of time as compared to a reference period of time. Index of Industrial Production - IIP - 2011-12 series, with 2011-12 normalized to 100 at the monthly level. The data is in reverse chronological order. Year Month IIP YoY Revisions (second) (first) 2020 Mar 120.1 -16.7% 2020 Feb 133.5 4.6% (133.3) 2020 Jan 137.2 2.1% (137.1) 2019 Dec 134.5 0.0% (134.0) (133.5)' 2019 Nov 128.8 1.8% (128.4) (128.4) 2019 Oct 124.0 -6.6% (127.5) (127.7) 2019 Sep 122.9 -4.6% (123.2) (123.3) 2019 Aug 126.2 -1.4% (126.2) (126.6) 2019 Jul 131.8 4.9% (131.5) (131.1) 2019 Jun 129.3 1.2% (129.2) (130.2) 2019 May 135.4 4.5% (135.5) (133.6) 2019 Apr 126.5 3.5% (127.9) (126.8) 2019 Mar 144...

Index of Industrial Production February 2020

February 2020 IIP = 133.3 February 2019 IIP = 127.6 YoY growth rate= 4.5% {Wiki} The level of the Index of Industrial Production (IIP) is an abstract number, the magnitude of which represents the status of production in the industrial sector for a given period of time as compared to a reference period of time. Index of Industrial Production - IIP - 2011-12 series, with 2011-12 normalized to 100 at the monthly level. The data is in reverse chronological order. Year Month IIP YoY Revisions (second) (first) 2020 Feb. 133.3 4.5% 2020 Jan 137.2 2.1% (137.1) 2019 Dec 134.0 0.0% (133.5)' 2019 Nov 128.8 1.8% (128.4) (128.4) 2019 Oct 124.0 -6.6% (127.5) (127.7) 2019 Sep 122.9 -4.6% (123.2) (123.3) 2019 Aug 126.2 -1.4% (126.2) (126.6) 2019 Jul 131.8 4.9% (131.5) (131.1) 2019 Jun 129.3 1.2% (129.2) (130.2) 2019 May 135.4 4.5% (135.5) (133.6) 2019 Apr 126.5 3.5% (127.9) (126.8) 2019 Mar 144.1 2.7% (140.8) 2019 Feb 127.6 0.2% (12...

Index of Industrial Production January 2020

January 2020 IIP = 137.1 January 2019 IIP = 134.4 YoY growth rate= 2.0% {Wiki} The level of the Index of Industrial Production (IIP) is an abstract number, the magnitude of which represents the status of production in the industrial sector for a given period of time as compared to a reference period of time. Index of Industrial Production - IIP - 2011-12 series, with 2011-12 normalized to 100 at the monthly level. The data is in reverse chronological order. Year Month IIP YoY Revisions (second) (first) 2020 Jan 137.1 2.0% 2019 Dec 134.0 0.0% (133.5)' 2019 Nov 128.4 1.8% (128.4) 2019 Oct 124.0 -6.6% (127.5) (127.7) 2019 Sep 122.9 -4.6% (123.2) (123.3) 2019 Aug 126.2 -1.4% (126.2) (126.6) 2019 Jul 131.8 4.9% (131.5) (131.1) 2019 Jun 129.3 1.2% (129.2) (130.2) 2019 May 135.4 4.5% (135.5) (133.6) 2019 Apr 126.5 3.5% (127.9) (126.8) 2019 Mar 144.1 2.7% (140.8) 2019 Feb 127.6 0.2% (127.5) 2019 Jan 134.4 2018 Dec 133.9 201...