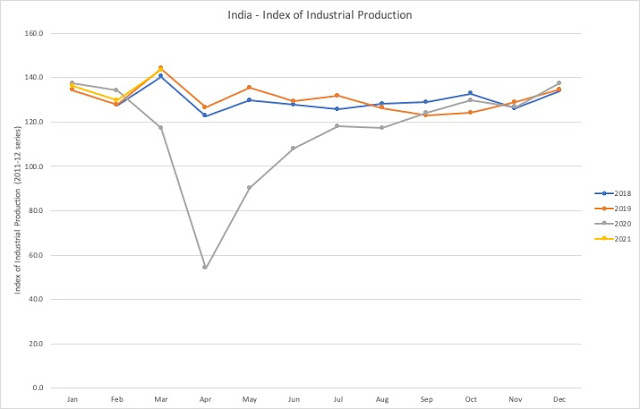
Index of Industrial Production March 2021
March 2021 IIP = 143.4
March 2020 IIP = 117.2
YoY growth: 22.4%
Index of Industrial Production - IIP - 2011-12 series, with 2011-12 normalized to 100 at the monthly level. The data is in reverse chronological order.
Year Month IIP     YoY   Revisions  (second) (first)
2021 Mar.  143.4  22.4%
2021 Feb   129.6  -3.4% (129.4)
2021 Jan   136.2  -0.9% (135.2)
2020 Dec   137.4   2.2% (136.6) (135.9)
2020 Nov   126.7  -1.6% (126.1) (126.3)
2020 Oct   129.6   4.5% (129.2) (128.5)
2020 Sep   124.1   0.1% (123.5) (123.2)
2020 Aug   117.2        (116.9) (116.1)
2020 Jul   117.9        (117.6) (118.1)
2020 Jun   107.9        (108.9) (107.8)
2020 May    90.2        ( 89.5) ( 88.4)
2020 Apr    54.0        ( 53.6) ( 56.3)
2020 Mar   117.2 -18.7% (117.7) (120.1)
2020 Feb   134.2   5.2% (133.5) (133.3)
2020 Jan   137.4   2.2% (137.2) (137.1)
2019 Dec   134.5   0.0% (134.0) (133.5)'
2019 Nov   128.8   1.8% (128.4) (128.4)
2019 Oct   124.0  -6.6% (127.5) (127.7)
2019 Sep   122.9  -4.6% (123.2) (123.3)
2019 Aug   126.2  -1.4% (126.2) (126.6)
2019 Jul   131.8   4.9% (131.5) (131.1)
2019 Jun   129.3   1.2% (129.2) (130.2)
2019 May   135.4   4.5% (135.5) (133.6)
2019 Apr   126.5   3.5% (127.9) (126.8)
2019 Mar   144.1   2.7% (140.8)
2019 Feb   127.6   0.2% (127.5)
2019 Jan   134.4
2018 Dec   133.9
2018 Nov   126.1
2018 Oct   132.8
2018 Sep   128.8
2018 Aug   128.0
2018 Jul   125.7
2018 Jun   127.7
2018 May   129.6
2018 Apr   122.6
2018 Mar   140.3
2018 Feb   127.4
Notes:
- 1. Along with the Quick Estimates of IIP for the month of March 2021, the indices for February 2021 have undergone the first revision and those for December 2020 have undergone the final revision in the light of the updated data received from the source agencies.
2. Release of the Index for April 2021 will be on Friday, 11thJune 2021
Data source: Ministry of Statistics and Program Implementation for February 2021


Comments
Post a Comment