Posts

Index of Core Industries January 2020

 New data for Index of Core Industries: 2020 January: 137.5 2019 January: 134.5  YoY growth: 2.2%  Details: The Ministry of Commerce and Industry Office of Economic Adviser (OEA), Department of Industrial Policy & Promotion (DIPP), reports a monthly index, ICI, "Index of Eight Core Industries (Base: 2011-12=100)".  "The Eight Core Industries comprise 40.27 per cent of the weight of items included in the Index of Industrial Production (IIP)." These are Coal, Crude Oil, Natural Gas, Refinery Products, Fertilizers, Steel, Cement, Electricity.   Also see:  https://currentaffairs.gktoday.in/tags/index-of-eight-core-industries The index: (note: reverse-chronological order) Month Index Revisions (second) (first) 2020 Jan 137.5 2019 Dec 134.3 (133.2) 2019 Nov 127.5 (126.3) 2019 Oct 127.4 (127.0) (127.0) 2019 Sep 120.7 (120.7) (120.6) 2019 Aug 128.5 (128.9) (128.2) 2019 Jul 132.6 (132.7) (131.9) 2019 Jun 132.8 (132.1) (131.4) 2019 May ...
Index of Industrial Production

December 2019 IIP = 133.5 December 2018 IIP = 133.9 YoY growth rate= -0.3% {Wiki} The level of the Index of Industrial Production (IIP) is an abstract number, the magnitude of which represents the status of production in the industrial sector for a given period of time as compared to a reference period of time. Index of Industrial Production - IIP - 2011-12 series, with 2011-12 normalized to 100 at the monthly level. The data is in reverse chronological order. Year Month IIP YoY Revisions (second) (first) 2019 Dec. 133.5 -0.3% 2019 Nov 128.4 1.8% (128.4) 2019 Oct 127.5 -4.0% (127.7) 2019 Sep 122.9 -4.6% (123.2) (123.3) 2019 Aug 126.2 -1.4% (126.2) (126.6) 2019 Jul 131.8 4.9% (131.5) (131.1) 2019 Jun 129.3 1.2% (129.2) (130.2) 2019 May 135.4 4.5% (135.5) (133.6) 2019 Apr 126.5 3.5% (127.9) (126.8) 2019 Mar 144.1 2.7% (140.8) 2019 Feb 127.6 0.2% (127.5) 2019 Jan 134.4 2018 Dec 133.9 2018 Nov 126.1 2018 Oct 132.8 2...

Index of Core Industries

New data for Index of Core Industries: 2019 December: 133.2 2018 December: 131.5  YoY growth: 1.3%  Details: The Ministry of Commerce and Industry Office of Economic Adviser (OEA), Department of Industrial Policy & Promotion (DIPP), reports a monthly index, ICI, "Index of Eight Core Industries (Base: 2011-12=100)".  "The Eight Core Industries comprise 40.27 per cent of the weight of items included in the Index of Industrial Production (IIP)." These are Coal, Crude Oil, Natural Gas, Refinery Products, Fertilizers, Steel, Cement, Electricity.  Also see: https://currentaffairs.gktoday.in/tags/index-of-eight-core-industries The index: (note: reverse-chronological order) Month Index Revisions (second) (first) 2019 Dec 133.2 2019 Nov 127.5 (126.3) 2019 Oct 127.0 (127.0) 2019 Sep 120.7 (120.7) (120.6) 2019 Aug 128.5 (128.9) (128.2) 2019 Jul 132.6 (132.7) (131.9) 2019 Jun 132.8 (132.1) (131.4) 2019 May 137.0 (137.6) (138.7) 2019 Apr...

Henley Passport Index

The Henley Passport Index ranks the world's passports according to the number of destinations their holders can access without a prior visa. In 2019, India ranked 82nd with 59 destinations with visa-free access (including Visa on Arrival and eTA - electronic travel authorization).   These were: Asia : Bhutan, Cambodia, Indonesia, Laos, Macao, Maldives, Myanmar, Nepal, Sri Lanka, Thailand, Timor Leste Europe : Serbia Africa : Cape Verde Islands, Comoros Islands, Ethiopia, Gabon, Guinea-Bissau, Kenya, Madagascar, Mauritania, Mauritius, Mozambique, Rwanda, Senegal, Seychelles, Sierra Leone, Somalia, Tanzania, Togo, Tunisia, Uganda, Zimbabwe. Oceania : Cook Islands, Fiji Marshall Islands, Micronesia, Niue, Palau Islands, Samoa, Tuvalu, Vanuatu Caribbean : British Virgin Islands, Dominica, Grenada, Haiti, Jamaica, Montserrat, St. Kitts and Nevis, St. Lucia, St. Vincent and the Grenadines, Trinidad and Tobago Americas : Bolivia, Ecuador, El Salvador, Suriname Middle Eas...

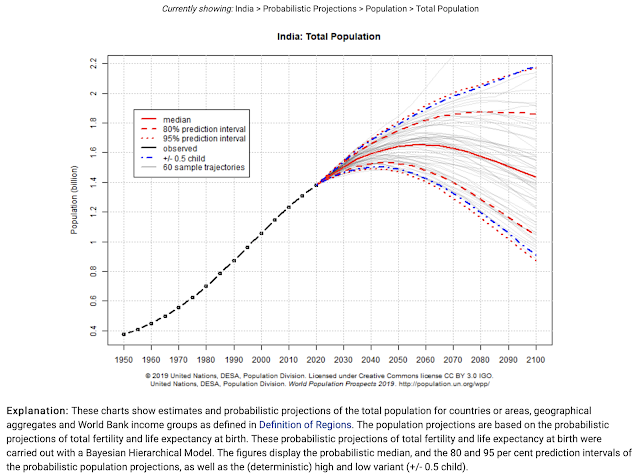
Total Population - UN World Population Prospects 2019

Image
UN World Population Prospects 2019, Total Population Projection for India. https://population.un.org/wpp/Graphs/

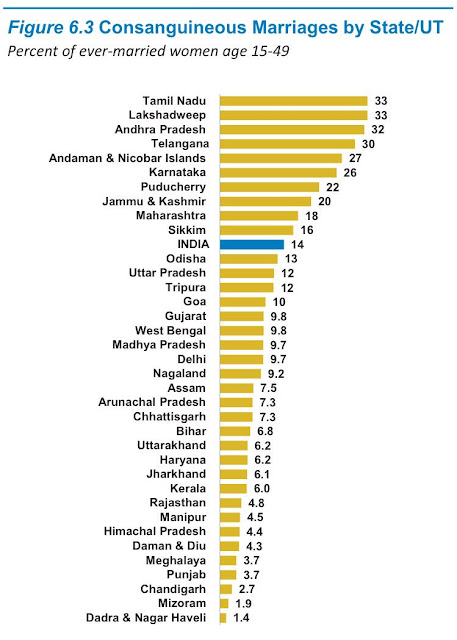
NFHS-4 Consanguineous Marriages by State

Image
National Family Health Survey-4 (2015-16) http://rchiips.org/nfhs/nfhs4.shtml

Commercial Vehicle Domestic Sales

Commercial vehicle domestic sales: 1995-96: 200,038 [3] 1996-97: 221,676 [3] 1997-98: 143,814 [3] 1998-99: 129,822 [3] 1999-00: 161,407 [3] 2000-01: 136,673 [3] 2001-02: 146,671 [3] 2001-02: 132,250 [1] 2002-03: 190,682 [4] 2002-03: 191,201 [3] 2003-04: 260,114 [4] 2004-05: 307,862 [4] 2005-06: 351,041 [4] 2006-07: 467,765 [4] 2007-08: 490,494 [5] 2007-08: 486,817 [4] 2008-09: 384,194 [5] 2009-10: 532,721 [5] 2010-11: 684,905 [5] 2011-12: 809,532 [5] 2012-13: 793,211 [6] 2013-14: 632,851 [2] 2014-15: 614,948 [2] 2015-16: 685,704 [2] 2016-17: 714,082 [2] 2017-18: 856,916 [2] 2018-19: 1,007,319 [2] #Only August 2018 -March 2019 data is available for 2018-19 [1] http://timesofindia.indiatimes.com/articleshow/6998761.cms [2] http://siamindia.com/statistics.aspx?mpgid=8&pgidtrail=14 [3] https://web.archive.org/web/20030523232047/http://siamindia.com/ [4] https://web.archive.org/web/20080510074242/http://www.siamindia.com/scripts/domestic-sales-trend.aspx [5] https://web.archive.o...