Posts

India - Population Pyramid

Image
From https://www.populationpyramid.net/, the estimate:

Solar 2022

  India Installs a Record 10 GW of Solar in 9M 2022 https://mercomindia.com/india-installs-a-record-10-gw-of-solar-in-9m-2022/

Index of Eight Core Industries July 2022

  Month 2018 2019 2020 2021 2022 Jan   134.5 137.4 139.2 144.8 Feb 123.2 125.9 134.0 129.6 137.1 Mar 138.5 146.5 134.0 150.8 158.0 Apr 124.3 130.7 81.2 132.0 144.6 May 131.9 137.0 107.7 125.4 149.5 Jun 131.2 132.8 116.3 127.2 144.0 Jul 129.2 132.6 122.5 134.7 140.7 Aug 128.8 128.5 119.7 134.2   Sep 127.2 120.7 121.4 128.0   Oct 134.8 127.4 126.7 137.8   Nov 128.3 129.2 127.7 131.8   Dec 131.5 135.5 136.1 141.7  

Big Picture: Comprehensive Discussion on NFHS - 5

Image
The National Family Health Survey 5 results: NFHS-5 web page: http://rchiips.org/nfhs/factsheet_NFHS-5.shtml

Index of Core Industries November 2021

Image
 

Index of Industrial Production, October 2021

Image

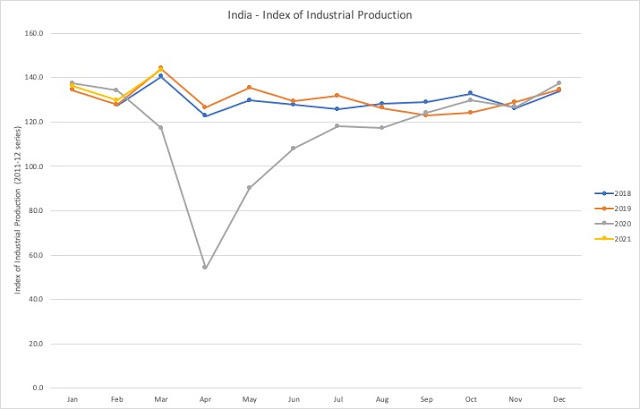
Index of Industrial Production March 2021

Image
March 2021 IIP = 143.4 March 2020 IIP = 117.2 YoY growth: 22.4% {Wiki} The level of the Index of Industrial Production (IIP) is an abstract number, the magnitude of which represents the status of production in the industrial sector for a given period of time as compared to a reference period of time. Index of Industrial Production - IIP - 2011-12 series, with 2011-12 normalized to 100 at the monthly level. The data is in reverse chronological order. Year Month IIP YoY Revisions (second) (first) 2021 Mar. 143.4 22.4% 2021 Feb 129.6 -3.4% (129.4) 2021 Jan 136.2 -0.9% (135.2) 2020 Dec 137.4 2.2% (136.6) (135.9) 2020 Nov 126.7 -1.6% (126.1) (126.3) 2020 Oct 129.6 4.5% (129.2) (128.5) 2020 Sep 124.1 0.1% (123.5) (123.2) 2020 Aug 117.2 (116.9) (116.1) 2020 Jul 117.9 (117.6) (118.1) 2020 Jun 107.9 (108.9) (107.8) 2020 May 90.2 ( 89.5) ( 88.4) 2020 Apr 54.0 ( 53.6) ( 56.3) 2020 Mar 117.2 -18.7% (117.7) (120.1) ...